

Load the R packages
libs = c("twitteR", "RCurl", "tm", "stringr", "wordcloud")
lapply(libs, require, character.only=TRUE)
function 1 : doOAuth
Read oauth credentials from file and connect to Twitter
Input - filepath, filename
doOAuth = function(path, filename){
file = paste(path,filename,sep='/')
oauthCreds = read.table(file,header=T)
setup_twitter_oauth(oauthCreds$consumer_key,
oauthCreds$consumer_secret,
oauthCreds$access_token,
oauthCreds$access_secret)
}
function 3 : getTweets_text
Retrieve the text part from tweets in list
Input - list containing tweets
Output - character vector
getTweets_text = function(tweets_list){
tweets_text = sapply(tweets_list, function(x) x$getText())
#str(tweets_text)
#class(tweets_text)
return (tweets_text)
}
function 5: get_score_for_tweet
Match each word with positive/negative words, if match is found then the position of the word in the list of positive/negative word is assigned otherwise NA is assigned
Get the scores by discarding NA values; final score for a tweet is difference between positive and negative scores
get_score_for_tweet = function(tweet_words, pos.words, neg.words){
pos.matches = match(tweet_words, pos.words)
neg.matches = match(tweet_words, neg.words)
#match() returns the position of the matched term or NA
#we just want not na, so for all values with position it will return true
pos.matches = !is.na(pos.matches)
neg.matches = !is.na(neg.matches)
score = sum(pos.matches)-sum(neg.matches)
return(score)
}
Plot Histogram for Analysis
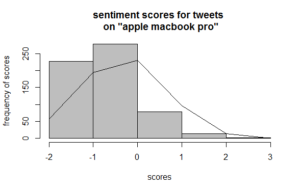
Start sentiment analysis using the scores for the words in tweets and plot histogram and normal distribution line on histrogram
# start analysis
attach(analysis)
summary(score)
# Min. 1st Qu. Median Mean 3rd Qu. Max.
# -2.0000 -1.0000 0.0000 -0.3383 0.0000 3.0000
# plot histogram
bins = seq(min(score), max(score), 1)
bins
# [1] -2 -1 0 1 2 3
h = hist(analysis$score, breaks=bins,
main='sentiment analysis of tweets',
ylab='frequency of scores',
xlab='scores',
col='grey')
# to plot normal distribution line on histogram
# create 6 bins from our data
xfit = seq(min(score), max(score), length=6)
# given our datas mean and sd, find the normal distribution
yfit = dnorm(xfit, mean=mean(score),,sd=sd(score))
# fit the normal dististribution to our data
yfit = yfit*diff(hh$mids[1:2])*length(score)
#plot these lines
lines(xfit,yfit)

