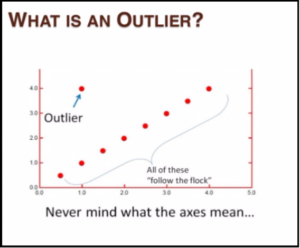
Outliers

In statistics an outlier is an observation point  that is distant from other observations. An outlier may be due to variability in the measurement or it may indicate experimental error which can sometimes be excluded from the dataset

Outliers could be result of incorrect entry eg. 1000 as 000 or mis-reporting, for example, intentional or motivated,  salary exaggerating in matrimonial sites.

We become curious when we come across exceptional values or outliers.  Outliers can be detected using boxplot, histogram, scatter plot

outliers-1-1

outliers-2-2

outliers-3-3

Programming Logic

Step to Identify Univariate and Bivariate outliers.

Pre-requisite:

Understand the dataset for any pre-processing that may be required to complete the ML task.

Step 1:
For Univariate outlier detection use boxplot stats to identify outliers and boxplot for visualization.

Step 2:
Use boxplot stats to determine outliers for each dimension or feature and scatter plot the data points using different colour for outliers.


Univariate outlier detection using boxplot

set.seed(3147)

# generate 100 random normal variables

x = rnorm(100)
summary(x)
# Min. 1st Qu. Median Mean 3rd Qu. Max.
# -3.3150 -0.4837 0.1867 0.1098 0.7120 2.6860

# boxplot x to see the outliers if any
# get statistics of outliers

boxplot.stats(x)$out
# [1] -3.315391 2.685922 -3.055717 2.571203

boxplot(x)

Boxplot showing outliers

Circles outside the min and max range are outliers for the univariate x

uni-outlier-1

Bivariate outlier detection using scatter plot

# bivariate outliers

set.seed(3147)

x = rnorm(100)
y = rnorm(100)
df = data.frame(x,y)
head(df)

#      x                               y
#     1 -3.31539150        0.7619774
#     2 -0.04765067     -0.6404403
#     3 0.69720806       0.7645655
#     4 0.35979073        0.3131930
#     5 0.18644193        0.1709528
#     6 0.27493834      -0.8441813

rm(x,y)

# find outliers in df for x and y

dfx_outliers = which(df$x %in% boxplot.stats(df$x)$out)
dfx_outliers
#[1] 1 33 64 74
# these are the indexes

dfy_outliers = which(df$y %in% boxplot.stats(df$y)$out)
dfy_outliers
#[1] 24 25 49 64 74
# these are the indexes

df_outlier_indexes = union(dfx_outliers,dfy_outliers)
df_outlier_indexes
[1] 1 33 64 74 24 25 49
# these indexes of outlier points in df

# scatter plot x,y

plot(df)

# point out the outlier, using outlier indexes, with different colour and symbol

points(df[df_outlier_indexes,], col="blue", pch="x", cex=2)

Scatter plot showing bivariate outliers

Blue crosses are outlier points

bivariate-outliers-1